The Theory of Related-ivity: Segment XIV
Wednesday, April 15, 2026 - 09:30

The Theory of Related-ivity:
A History and Analysis of the Best Related Work Hugo Category
by Heather Rose Jones
(This is a serialized article exploring the history of the Best Related Work Hugo category in its various names and versions. If you’ve come in at the middle, start here.)
Contents
Part 3: Historic Trends
3.3 Category
3.3.6 Category Supergenres
3.3.6.1 Analysis
3.3.6.2 Information
3.3.6.3 People
3.3.6.4 Images
3.3.6.5 Associated
Part 3: Historic Trends
3.3 Category
3.3.6 Category Supergenres
As much of the preceding analysis involves categories with very small numbers, as well as overlap when works are tagged with multiple categories, it’s worth returning to the uniquely assigned Supercategories to review overall trends.
As a reminder, the following Supercategories have been used:
- Analysis: Craft, Criticism, Essays, Journalism, Reviews
- Associated: Convention, Convention Publications, Experience, Fiction, Graphic, Humor, Music, Poetry, Role Playing Game
- Image: Art, Photography
- Information: History, Reference, Science
- People: Autobiography, Biography, Interviews, Letters, Memoir
The individual Supercategories are discussed in decreasing order of overall popularity. Many of the descriptive statistics in these chapters were already presented in the Introduction chapter to the Categories section, but here the focus is on change within the Supercategory over time, as well as a granular look at year-by-year trends.
3.3.6.1 Analysis
The Analysis Supercategory includes works predominantly consisting of Craft, Criticism, Essays, Journalism, or Reviews. The general theme is interpretive discussion of a topic. Numerically it is well in the lead over the other Supercategories.
Overall, 231 works (38% of the full data set) are classified as Analysis. In the 46 years in which Best Related has existed they appear as follows:
Best Non-Fiction Book
- Finalists in 15 out of 18 years (83%)
- 26% of Finalists
- 11% of Winners
- (Long List data not available)
Best Related Book
- Finalists in 10 out of 12 years (83%)
- 34% of Finalists
- 33% of Winners
- Long List in 12 years (100%)
- 32% of Long List
Best Related Work
- Finalists in 16 out of 16 years (100%)
- 50% of Finalists
- 38% Winners
- Long list in 16 years (100%)
- 49% of Long List
Figures 33 and 34 show the percentage for each year that Analysis appeared as Finalist or Long List.
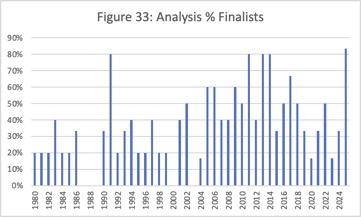
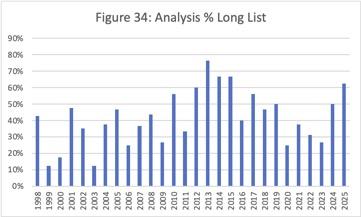
Analysis works appear in a large majority of years in both Finalists and Long Lists, culminating in the Related Work era where there are no years without Analysis Finalists. Their presence increases over time, with Finalist and Long List percentages functionally identical, from a quarter of the total in the Non-Fiction era, to a third under Related Book, to a half under Related Work. Winners, however, are under-represented compared to the Finalist numbers, achieving parity only in the Related Book era.
The figures show the dominance of this Supercategory in the recent half of Best Related’s lifespan, but this dominance is not clearly related to changes to the category scope. The step-up in presence among Finalists begins around 2005, around the middle of the Related Book era. Analysis peaks on the Long List in 2013, accounting for 75% of the total that year. Although that date was around when new Media formats began appearing, a few years into the Related Work era, only 1 of the Analysis works in 2013 is not a Book. It would be several more years before the Article/Blog format begins to come even with Books among Analysis works.
3.3.6.2 Information
The Information Supercategory includes works predominantly consisting of History, Reference, or Science. The focus is on the presentation of Information.
Overall, 127 works (21% of the full data set) are classified as Information. In the 46 years in which Best Related has existed they appear as follows:
Best Non-Fiction Book
- Finalists in 15 out of 18 years (83%)
- 25% of Finalists
- 44% of Winners
- (Long List data not available)
Best Related Book
- Finalists in 9 out of 12 years (75%)
- 21% of Finalists
- 17% of Winners
- Long List in 12 years (100%)
- 22% of Long List
Best Related Work
- Finalists in 10 out of 16 years (63%)
- 16% of Finalists
- 19% Winners
- Long list in 16 years (100%)
- 18% of Long List
Figures 35 and 36 show the percentage for each year that Information appeared as Finalist or Long List.
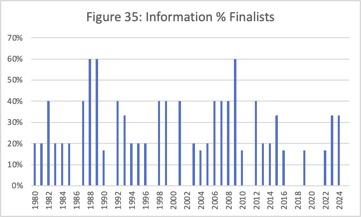
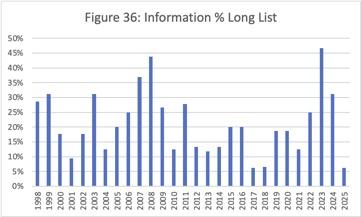
Once again, this Supercategory is present in a large majority of years, both among Finalists and Long Lists. But in contrast to Analysis, in terms of percentages, Information declines at both levels across the history of the category. Information dominates Winners in the Non-Fiction era, significantly over-performing relative to the proportion of Finalists, but in the 2 later eras, Winners are more closely proportional to Finalists. The figures don’t show any clear year-by-year shifts of note. There isn’t a clear-cut change in behavior around either of the changes in category scope.
Information works are predominantly in Book format, but for a brief period in 2014-2016 the Article/Blog format is more common. This period included the two years of significant Puppy slate activity (3 of the 8 works during those years) which may have prioritized the quick turnaround time of blogging over the lead time for published Books.
3.3.6.3 People
The People Supercategory includes works predominantly consisting of Autobiography, Biography, Interviews, Letters, or Memoir.
Overall, 97 works (16% of the full data set) are classified as People. In the 46 years in which Best Related has existed they appear as follows:
Best Non-Fiction Book
- Finalists in 15 out of 18 years (83%)
- 24% of Finalists
- 28% of Winners
- (Long List data not available)
Best Related Book
- Finalists in 6 out of 12 years (50%)
- 10% of Finalists
- 17% of Winners
- Long List in 12 years (100%)
- 11% of Long List
Best Related Work
- Finalists in 12 out of 16 years (75%)
- 24% of Finalists
- 19% Winners
- Long list in 13 years (81%)
- 18% of Long List
Figures 37 and 38 show the percentage for each year that People appeared as Finalist or Long List.
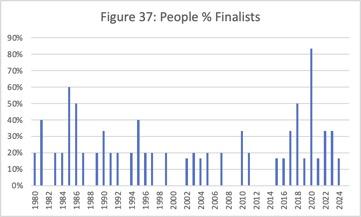
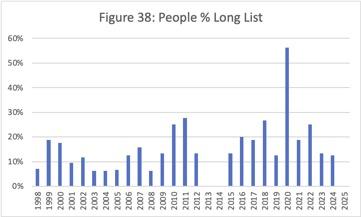
Works about People show an irregular pattern: more common in the Non-Fiction and Related Work eras than the middle era. Looking back at the two component Content types discussed above, the Autobiography group starts more popular and decreases, while Biography increases slightly over time, but is sparser during the Related Book era. Together this could explain the bimodal distribution, which can also be seen in the figures. Overall, People works outperform as Winners compared to the proportion of Finalists, though this is not the case in the Related Work era. There is a notable gap in People representation in 2013-2014 with no obvious explanation except possibly the rise in interest in less traditional forms and topics inspired by the increased scope. Whatever caused the effect, it was clearly temporary. A discussion of gender in the People group can be found under Other Tags.
3.3.6.4 Images
The Images Supercategory contains works predominantly consisting of Art or Photography. As only 2 works appear under Photography, this is functionally identical to the Art Category, but with some of the cross-categorized works shifted elsewhere. Although the Supercategory statistics are presented below, the discussion under Art will suffice here as well.
Overall, 92 works (15% of the full data set) are classified as Images. In the 46 years in which Best Related has existed they appear as follows:
Best Non-Fiction Book
- Finalists in 13 out of 18 years (72%)
- 20% of Finalists
- 6% of Winners
- (Long List data not available)
Best Related Book
- Finalists in 10 out of 12 years (83%)
- 27% of Finalists
- 33% of Winners
- Long List in 12 years (100%)
- 25% of Long List
Best Related Work
- Finalists in 1 out of 16 years (6%)
- 1% of Finalists
- No Winners
- Long list in 7 years (44%)
- 4% of Long List
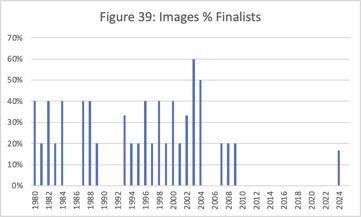
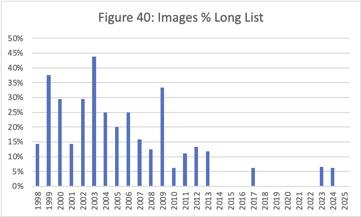
Figures 39 and 40 show the percentage for each year that Images appeared as Finalist or Long List.
3.3.6.5 Associated
The Associated Supercategory is, to some extent, a catch-all grouping (within the catch-all award) of subject matter that doesn’t fall in any of the preceding. It covers: Conventions, Convention Publications, Experience, Fiction, Graphic works, Humor, Music, Poetry, and Role-Playing Games. These include many of the types of works that come under most scrutiny with respect to scope appropriateness.
Overall, 60 works (10% of the full data set) are classified as Associated. In the 46 years in which Best Related has existed they appear as follows:
Best Non-Fiction Book
- Finalists in 5 out of 18 years (28%)
- 5% of Finalists
- 11% of Winners
- (Long List data not available)
Best Related Book
- Finalists in 3 out of 12 years (25%)
- 8% of Finalists
- No Winners
- Long List in 10 years (83%)
- 11% of Long List
Best Related Work
- Finalists in 5 out of 16 years (31%)
- 9% of Finalists
- 13% Winners
- Long list in 10 years (63%)
- 11% of Long List
Figures 41 and 42 show the percentage for each year that Associated appeared as Finalist or Long List.
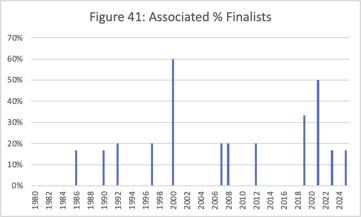
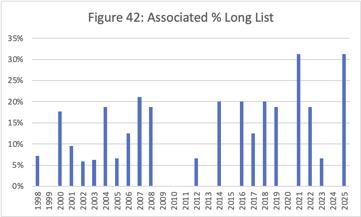
Although the specific nature of the works may differ by era, the presence of Associated works as a whole doesn’t show drastic changes between eras, either for Finalists or Long Lists. Winners out-perform Finalists in the Non-Fiction era and possibly slightly in the Related Work era, but are entirely absent in the Related Book era. The scarcity of Long List works from 2009-2013 corresponds to the delay in nominators reacting to the expanded scope of the Related Work era, but when nominations pick up after that, we see a wealth of non-traditional Media formats in this group, with 20 out of the 28 Long List nominees from 2014-2025 appearing as something other than a Book. This expansion in scope of the Long List, however, did not clearly translate to recognition at higher levels except for a small cluster of Finalists in 2019 and 2021.
It’s in the specific types of Associated content that we see most clearly the effects of Category scope, with the Non-Fiction and Related Book eras primarily involving Graphic works, Humor, Fiction, and Convention Publications. These themes continue up through 2018, after which the content and format types become more diverse.
(Segment XV will cover Part 3 Historic Trends, Chapters under Section 3.4 Other Tags.)
Major category: